PfRの設定例
目次
ネットワーク構成
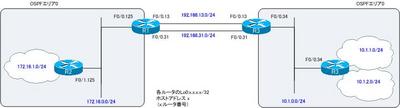
図 PfR演習 ネットワーク構成
初期設定
R1
----------------------------------------------------------------------
interface Loopback0
ip address 1.1.1.1 255.255.255.255
!
interface FastEthernet0/0.13
encapsulation dot1Q 13
ip address 192.168.13.1 255.255.255.0
!
interface FastEthernet0/0.31
encapsulation dot1Q 31
ip address 192.168.31.1 255.255.255.0
!
interface FastEthernet0/0.125
encapsulation dot1Q 125
ip address 172.16.0.1 255.255.255.0
!
router ospf 1
router-id 1.1.1.1
log-adjacency-changes
network 1.1.1.1 0.0.0.0 area 0
network 172.16.0.1 0.0.0.0 area 0
default-information originate
!
ip route 0.0.0.0 0.0.0.0 192.168.13.3
ip route 0.0.0.0 0.0.0.0 192.168.31.3
----------------------------------------------------------------------
R2
----------------------------------------------------------------------
interface Loopback0
ip address 2.2.2.2 255.255.255.255
!
interface Loopback1
ip address 172.16.1.2 255.255.255.0
ip ospf network point-to-point
!
interface FastEthernet0/1.125
encapsulation dot1Q 125
ip address 172.16.0.2 255.255.255.0
!
router ospf 1
router-id 2.2.2.2
log-adjacency-changes
network 2.2.2.2 0.0.0.0 area 0
network 172.16.0.2 0.0.0.0 area 0
network 172.16.1.2 0.0.0.0 area 0
----------------------------------------------------------------------
R3
----------------------------------------------------------------------
interface Loopback0
ip address 3.3.3.3 255.255.255.255
!
interface FastEthernet0/0.13
encapsulation dot1Q 13
ip address 192.168.13.3 255.255.255.0
!
interface FastEthernet0/0.31
encapsulation dot1Q 31
ip address 192.168.31.3 255.255.255.0
!
interface FastEthernet0/0.34
encapsulation dot1Q 34
ip address 10.0.0.3 255.255.255.0
!
interface FastEthernet0/0.35
encapsulation dot1Q 35
ip address 192.168.35.3 255.255.255.0
shutdown
!
router ospf 1
router-id 3.3.3.3
log-adjacency-changes
network 3.3.3.3 0.0.0.0 area 0
network 10.0.0.3 0.0.0.0 area 0
default-information originate
!
ip route 0.0.0.0 0.0.0.0 192.168.13.1
ip route 0.0.0.0 0.0.0.0 192.168.31.1
ip route 0.0.0.0 0.0.0.0 192.168.35.5
----------------------------------------------------------------------
R4
----------------------------------------------------------------------
interface Loopback0
ip address 4.4.4.4 255.255.255.255
!
interface Loopback1
ip address 10.1.1.4 255.255.255.0
ip ospf network point-to-point
!
interface Loopback2
ip address 10.1.2.4 255.255.255.0
ip ospf network point-to-point
!
interface FastEthernet0/0.34
encapsulation dot1Q 34
ip address 10.0.0.4 255.255.255.0
!
router ospf 1
router-id 4.4.4.4
log-adjacency-changes
network 4.4.4.4 0.0.0.0 area 0
network 10.0.0.4 0.0.0.0 area 0
network 10.1.1.4 0.0.0.0 area 0
network 10.1.2.4 0.0.0.0 area 0
----------------------------------------------------------------------
Step1 MCの設定
R1をPfRのマスタコントローラ(以下、MC)として設定します。R1はボーダールータ(以下、BR)としても動作させます。MCとBRの通信は、R1 Lo0のIPアドレス1.1.1.1を利用するものとします。
R1
----------------------------------------------------------------------
key chain pfr
key 1
key-string pfr
!
oer master
logging
!
border 1.1.1.1 key-chain pfr
interface FastEthernet0/0.125 internal
interface FastEthernet0/0.31 external
interface FastEthernet0/0.13 external
----------------------------------------------------------------------
Step2 BRの設定
R1をBRとして設定します。
R1
----------------------------------------------------------------------
oer border
logging
local Loopback0
master 1.1.1.1 key-chain pfr
----------------------------------------------------------------------
Step3 MC/BRの確認
R1でのMCおよびBRの設定を確認します。確認のために、次のshowコマンドを利
用します。
- show oer master border detail
- show oer border
R1
----------------------------------------------------------------------
R1-PfR#show oer master border detail
Border           Status   UP/DOWN             AuthFail
1.1.1.1          ACTIVE   UP       00:00:11          0
Fa0/0.13        EXTERNAL UP
Fa0/0.31        EXTERNAL UP
Fa0/0.125       INTERNAL UP
External         Capacity      Max BW   BW Used Tx Load Status          Exit Id
Interface         (kbps)       (kbps)    (kbps)    (%)
---------        --------      ------   ------- ------- ------           ------
Fa0/0.13           100000       75000         0       0 UP                    4
Fa0/0.31           100000       75000         0       0 UP                    3
R1-PfR#show oer border
OER BR 1.1.1.1 ACTIVE, MC 1.1.1.1 UP/DOWN: UP 00:01:02,
Auth Failures: 0
Conn Status: SUCCESS, PORT: 3949
Exits
Fa0/0.13        EXTERNAL
Fa0/0.31        EXTERNAL
Fa0/0.125       INTERNAL
----------------------------------------------------------------------
BRのInternal InterfaceとExit Interfaceは、次の図の通りです。
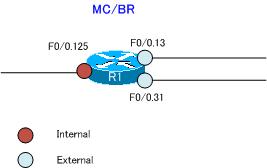
図 Internal InterfaceとExit Interface
Step4 Profileフェーズの設定
PfRのProfileフェーズでは、デフォルトのモニタリングを行います。BRを経由するトラフィックフローを見て、自動的にトラフィッククラスを学習します。その際、スループットとDelayをチェックし、トラフィックの計測は1分間行います。計測が終わると、すぐに次の計測を開始します。また、トラフィッククラスを制御するために/32のプレフィクス長のルートを生成し、30分間有効とします。
R1
----------------------------------------------------------------------
oer master
learn
throughput
delay
periodic-interval 0
monitor-period 1
expire after time 30
aggregation-type prefix-length 32
----------------------------------------------------------------------
Step5 TCPトラフィックの生成
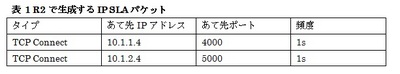
PfRのパッシブモニタリングによるパフォーマンス計測を行うために、BRを経由するTCPトラフィックを生成します。TCPトラフィックの生成のため、R2でIP SLAの設定を行います。R2で生成するIP SLAのパケットは次の通りです。
表 R2で生成するIP SLAパケット
R2
----------------------------------------------------------------------
ip sla monitor 1
type tcpConnect dest-ipaddr 10.1.1.4 dest-port 4000
timeout 1000
frequency 1
ip sla monitor schedule 1 life forever start-time now
ip sla monitor 2
type tcpConnect dest-ipaddr 10.1.2.4 dest-port 5000
timeout 1000
frequency 1
ip sla monitor schedule 2 life forever start-time now
----------------------------------------------------------------------
また、TCP ConnectのIP SLAなので、あて先デバイスのR4をIP SLA responderとして設定します。
R4
----------------------------------------------------------------------
ip sla monitor responder
----------------------------------------------------------------------
R2/R4でIP SLAの設定と動作を確認します。
R2
----------------------------------------------------------------------
R2-PfR#show ip sla monitor configuration
SA Agent, Infrastructure Engine-II
Entry number: 1
Owner:
Tag:
Type of operation to perform: tcpConnect
Target address: 10.1.1.4
Source address: 0.0.0.0
Target port: 4000
Source port: 0
Operation timeout (milliseconds): 1000
Type Of Service parameters: 0x0
Control Packets: enabled
Operation frequency (seconds): 1
~省略~
Entry number: 2
Owner:
Tag:
Type of operation to perform: tcpConnect
Target address: 10.1.2.4
Source address: 0.0.0.0
Target port: 5000
Source port: 0
Operation timeout (milliseconds): 1000
Type Of Service parameters: 0x0
Control Packets: enabled
Operation frequency (seconds): 1
~省略~
R2-PfR#show ip sla monitor statistics
Round trip time (RTT)   Index 1
Latest RTT: 8 ms
Latest operation start time: *07:15:57.987 UTC Thu Jan 27 2011
Latest operation return code: OK
Number of successes: 85
Number of failures: 0
Operation time to live: Forever
Round trip time (RTT)   Index 2
Latest RTT: 4 ms
Latest operation start time: *07:15:57.995 UTC Thu Jan 27 2011
Latest operation return code: OK
Number of successes: 82
Number of failures: 0
Operation time to live: Forever
----------------------------------------------------------------------
R4
----------------------------------------------------------------------
R4-PfR#show ip sla monitor responder
IP SLA Monitor Responder is: Enabled
Number of control message received: 247 Number of errors: 0
Recent sources:
172.16.0.2 [06:59:11.351 UTC Thu Jan 27 2011]
172.16.0.2 [06:59:11.351 UTC Thu Jan 27 2011]
172.16.0.2 [06:59:10.351 UTC Thu Jan 27 2011]
172.16.0.2 [06:59:10.347 UTC Thu Jan 27 2011]
172.16.0.2 [06:59:09.351 UTC Thu Jan 27 2011]
Recent error sources:
----------------------------------------------------------------------
次の図は、IP SLAによるTCPトラフィックの生成を表しています。
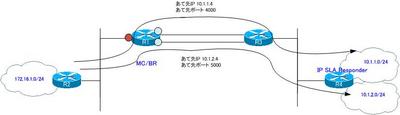
図 IP SLAによるTCPトラフィックの生成
Step5 PfR Measureフェーズの確認
トラフィッククラスのパフォーマンス計測は、デフォルトのbothを利用するものとします。bothのモニタリングでは、Netflowのパッシブモニタリングでトラフィッククラスのパフォーマンスを計測し、自動的にIP SLAプローブを送信するアクティブモニタリングを行います。
BRであるR1でパッシブモニタリングとアクティブモニタリングの確認を行います。
- show oer border passive learn
- show oer border passive cache learned
- show oer border passive cache prefix
- show oer border active-probes
R1
----------------------------------------------------------------------
R1-PfR#show oer border passive learn
OER Border Learn Configuration :
State is enabled
Measurement type: throughput and delay, Duration: 1 min
Aggregation type: prefix-length, Prefix length: 32
No port protocol config
R1-PfR#show oer border passive cache learned
OER Learn Cache:
State is enabled
Measurement type: throughput and delay, Duration: 1 min
Aggregation type: prefix-length, Prefix length: 32
4096 oer-flows per chunk,
16 chunks allocated, 32 max chunks,
2 allocated records, 65534 free records, 7602688 bytes allocated
Prefix         Mask     Pkts  B/Pk  Delay Samples   Active
Host1          Host2          Host3          Host4          Host5
dport1         dport2         dport3         dport4         dport5
10.1.2.4        /32      45     27     14      5       3.0
10.1.2.4       0.0.0.0        0.0.0.0        0.0.0.0        0.0.0.0
5000            0               0               0               0
10.1.1.4        /32      45     27     21      5       3.0
10.1.1.4       0.0.0.0        0.0.0.0        0.0.0.0        0.0.0.0
4000            0               0               0               0
R1-PfR#show oer border passive cache prefix
OER Passive Prefix Cache, State: enabled, 278544 bytes
4 active, 4092 inactive, 33 added
1839 ager polls, 0 flow alloc failures
Active flows timeout in 1 minutes
Inactive flows timeout in 15 seconds
IP Sub Flow Cache, 21640 bytes
8 active, 1016 inactive, 66 added, 33 added to flow
0 alloc failures, 0 force free
1 chunk, 1 chunk added
Prefix              NextHop         Src If         Dst If          Flows
Pkts   B/Pk  Active   sDly   #Dly  PktLos  #UnRch
------------------------------------------------------------------------
10.1.1.4/32         192.168.31.3    Fa0/0.125      Fa0/0.31          65
105      48    35.0     80     21       0       0
10.1.2.4/32         192.168.31.3    Fa0/0.125      Fa0/0.31          72
105      48    35.0     87     21       0       0
10.1.2.4/32         0.0.0.0         Fa0/0.13       Fa0/0.125         79
80      40    34.0      0      0       0       0
10.1.1.4/32         0.0.0.0         Fa0/0.13       Fa0/0.125         88
88      40    36.0      0      0       0       0
R1-PfR#show oer border active-probes
OER Border active-probes
Type      = Probe Type
Target    = Target IP Address
TPort     = Target Port
Source    = Send From Source IP Address
Interface = Exit interface
Att       = Number of Attempts
Comps   = Number of completions
N - Not applicable
Type     Target          TPort Source          Interface           Att   Comps
echo     10.1.2.4            N 192.168.13.1    Fa0/0.13              1       1
echo     10.1.1.4            N 192.168.13.1    Fa0/0.13              1       1
----------------------------------------------------------------------
次の図は、BRであるR1のモニタリングの様子を表したものです。
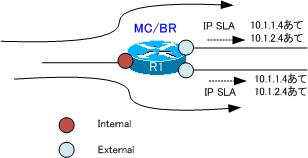
図 パッシブ/アクティブモニタリング
Step6 PfRポリシーの設定(Apply Policyフェーズ)
MCであるR1でPfRポリシーを設定します。設定するポリシーは次の通りです。
表 PfRポリシー
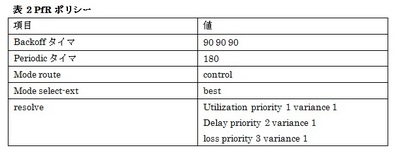
このあとのStepで最適なExit Interfaceの切り替わりをわかりやすくするために、Utilizationを最優先で評価します。また、最適なExit InterfaceがR1 Fa0/0.13になるようにR1 Fa0/0.31のBWを小さく(10kbps)とします。
R1
----------------------------------------------------------------------
oer master
backoff 90 90
mode route control
mode select-exit best
periodic 180
resolve utilization priority 1 variance 1
resolve delay priority 2 variance 1
resolve loss priority 3 variance 1
!
interface FastEthernet0/0.31
bandwidth 10
----------------------------------------------------------------------
Step7 PfRポリシーの確認
Step6で設定したPfRポリシーをshow oer master policyコマンドで確認します。
R1
----------------------------------------------------------------------
R1-PfR#show oer master policy
Default Policy Settings:
backoff 90 90 90
delay relative 50
holddown 300
periodic 180
mode route control
mode monitor both
mode select-exit best
loss relative 10
unreachable relative 50
resolve utilization priority 1 variance 1
resolve delay priority 2 variance 1
resolve loss priority 3 variance 1
----------------------------------------------------------------------
Step8 PfR Enforceフェーズ ルート制御の確認
R1 Fa0/0.31のBWを10kbpsと小さくしてUtilizationが大きくなるようにしているため、現在の最適なExit InterfaceはR1 Fa0/0.13です。R1 Fa0/0.13をExit InterfaceとするPfRのスタティックルートが自動的に生成されることを確認します。
R1
----------------------------------------------------------------------
R1-PfR#show oer border routes static
Flags: C - Controlled by oer, X - Path is excluded from control,
E - The control is exact, N - The control is non-exact
Flags Network            Parent             Tag
CE    10.1.1.4/32        0.0.0.0/0          5000
CE    10.1.2.4/32        0.0.0.0/0          5000
R1-PfR#show ip route
~省略~
Gateway of last resort is 192.168.31.3 to network 0.0.0.0
1.0.0.0/32 is subnetted, 1 subnets
C       1.1.1.1 is directly connected, Loopback0
C    192.168.13.0/24 is directly connected, FastEthernet0/0.13
2.0.0.0/32 is subnetted, 1 subnets
O       2.2.2.2 [110/2] via 172.16.0.2, 00:31:03, FastEthernet0/0.125
C    192.168.31.0/24 is directly connected, FastEthernet0/0.31
172.16.0.0/24 is subnetted, 2 subnets
C       172.16.0.0 is directly connected, FastEthernet0/0.125
O       172.16.1.0 [110/2] via 172.16.0.2, 00:31:04, FastEthernet0/0.125
10.0.0.0/32 is subnetted, 2 subnets
S       10.1.2.4 [1/0] via 192.168.13.3
S       10.1.1.4 [1/0] via 192.168.13.3
S*   0.0.0.0/0 [1/0] via 192.168.31.3
[1/0] via 192.168.13.3
----------------------------------------------------------------------
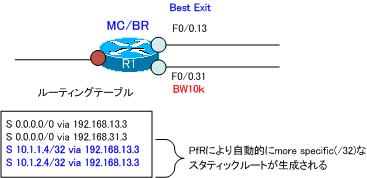
図 PfRによるスタティックルートの生成
Step9 ルートの切り替わりの確認
Exit Interfaceの切り替えを確認するために、R1 Fa0/0.13のBWを10Kとします。
また、R1 Fa0/0.31のBWをデフォルトに戻します。
R1
----------------------------------------------------------------------
interface FastEthernet0/0.13
bandwidth 10
!
interface FastEthernet0/0.31
no bandwidth
----------------------------------------------------------------------
その後、R1で最適なExit InterfaceがR1 Fa0/0.31に切り替わることを確認します。
R1
----------------------------------------------------------------------
R1-PfR#show oer master prefix
OER Prefix Statistics:
Pas - Passive, Act - Active, S - Short term, L - Long term, Dly - Delay (ms),
Los - Packet Loss (packets-per-million), Un - Unreachable (flows-per-million),
E - Egress, I - Ingress, Bw - Bandwidth (kbps), N - Not applicable
U - unknown, * - uncontrolled, + - control more specific, @ - active probe all
Prefix                  State     Time Curr BR         CurrI/F         Protocol
PasSDly  PasLDly   PasSUn   PasLUn  PasSLos  PasLLos
ActSDly  ActLDly   ActSUn   ActLUn      EBw      IBw
--------------------------------------------------------------------------------
10.1.1.4/32          HOLDDOWN      300 1.1.1.1         Fa0/0.31        STATIC
U        U        0        0        0        0
U        U        0        0        1        1
10.1.2.4/32          HOLDDOWN      313 1.1.1.1         Fa0/0.31        STATIC
U        U        0        0        0        0
U        U        0        0        1        1
R1-PfR#show oer border routes static
Flags: C - Controlled by oer, X - Path is excluded from control,
E - The control is exact, N - The control is non-exact
Flags Network            Parent             Tag
CE    10.1.1.4/32        0.0.0.0/0          5000
CE    10.1.2.4/32        0.0.0.0/0          5000
R1-PfR#show ip route
~省略~
Gateway of last resort is 192.168.31.3 to network 0.0.0.0
1.0.0.0/32 is subnetted, 1 subnets
C       1.1.1.1 is directly connected, Loopback0
C    192.168.13.0/24 is directly connected, FastEthernet0/0.13
2.0.0.0/32 is subnetted, 1 subnets
O       2.2.2.2 [110/2] via 172.16.0.2, 00:37:54, FastEthernet0/0.125
C    192.168.31.0/24 is directly connected, FastEthernet0/0.31
172.16.0.0/24 is subnetted, 2 subnets
C       172.16.0.0 is directly connected, FastEthernet0/0.125
O       172.16.1.0 [110/2] via 172.16.0.2, 00:37:55, FastEthernet0/0.125
10.0.0.0/32 is subnetted, 2 subnets
S       10.1.2.4 [1/0] via 192.168.31.3
S       10.1.1.4 [1/0] via 192.168.31.3
S*   0.0.0.0/0 [1/0] via 192.168.31.3
[1/0] via 192.168.13.3
----------------------------------------------------------------------
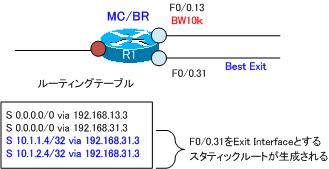
図 ルートの切り替わり