IP SLAの概要
目次
IP SLAの概要
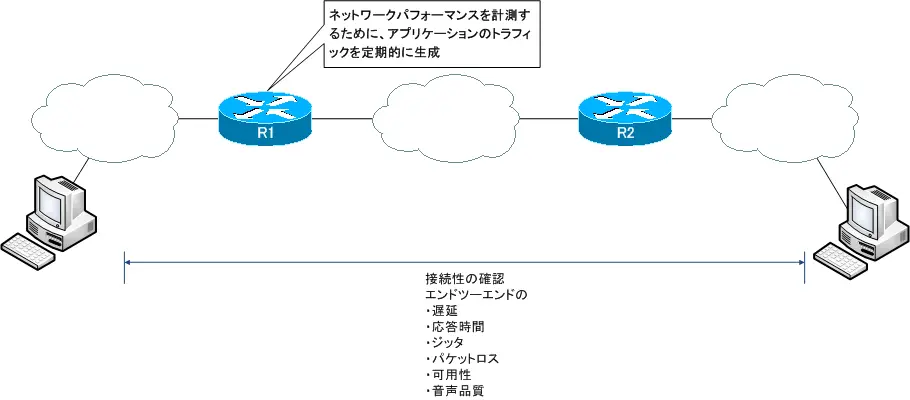
IPネットワーク上でさまざまなアプリケーションやサービスが動作しています。IP SLAは、それらのアプリケーションやサービスのデータを適切に転送できるかどうかを確認するための仕組みです。IP SLAによって以下のことを実現できます。
- 接続性の確認
- ネットワークのパフォーマンス計測
遅延
応答時間
パケットロス
可用性
ジッター
音声品質
しきい値を超えたときにSNMP Trapで通知することも可能
IP SLAでは、定期的に確認用パケット(プローブパケット)を生成して、上記の接続性の確認やパフォーマンス計測を行っています。
IP SLAの設定
IP SLAの設定は、次の手順で行います。
- 確認用パケットの設定
確認用パケットの設定は、グローバルコンフィグレーションモードで次のコマ
ンドを利用します。
(config)#ip sla monitor <operation-number>
(config-sla-monitor)#
<operation-number> : IP SLAの確認用パケットを識別するための番号。
(config-sla-monitor)#の配下で、確認用パケットの詳細を定義します。さまざまな設定が可能です。例としてICMPによる接続性の確認用パケットは以下のコマンドを利用します。
(config-sla-monitor)#type echo protocol ipIcmpEcho {<destination-ip-address> | <destination-hostname>} [source-ipaddr {<ip-address> | <hostname>} | source-interface <interface-name>] (config-sla-monitor)# frequency <seconds>
<destination-ip-address> : 宛先IPアドレス
<destination-hostname> : 宛先ホスト名
<ip-address> : IPアドレス
<hostname> : ホスト名
<interface-name> : インタフェース名
<seconds> : 確認用パケットの送信間隔
- スケジュールの設定
次にIP SLAの動作スケジュールを設定します。グローバルコンフィグレーションモードで以下のコマンドを利用します。
(config)#ip sla monitor schedule <operation-number> [life {forever | <seconds>}] [start-time {<hh:mm[:ss]> [<month> <day> | <day> <month>] | pending | now | after <hh:mm:ss>]
<operation-number> : IP SLAの確認用パケットを識別するための番号。
life forever : IP SLAの動作を永続的に行います。
life <seconds> : IP SLAの動作を実行する時間です。デフォルト3600
start-time : IP SLAの動作を開始する時間を表します。
{<hh:mm[:ss]> [<month> <day> | <day> <month>] : 動作を開始する日付と時間を指定します。日付を省略すると、現在の日とします。
pending : IP SLAの動作を開始しません。
now : IP SLAの動作をすぐに開始します。
after <hh:mm:ss> : コマンドを入力してから指定時間後にIP SLAの動作を開始します。
192.168.4.100のホストに対して1分間隔でICMPによる接続性の確認を行うためのIP SLAの設定は次のようになります。
--------------------------------------
ip sla monitor 1
type echo protocol ipIcmpEcho 192.168.4.100
ip sla monitor schedule 1 life forever start-time now
--------------------------------------
IP SLAの確認は、以下のshowコマンドを利用します。
- show ip sla monitor configuration
IP SLA確認用パケットを確認します。 - show ip sla monitor statistics
IP SLAによる接続性の成否やネットワークのパフォーマンスなどの統計情報を確認します。
show ip sla monitor configurationコマンドの例は以下のようになります。
----------------------------------------------------------------------
R5#show ip sla monitor configuration
SA Agent, Infrastructure Engine-II
Entry number: 1
Owner:
Tag:
Type of operation to perform: echo
Target address: 192.168.1.100
Request size (ARR data portion): 28
Operation timeout (milliseconds): 5000
Type Of Service parameters: 0x0
Verify data: No
Operation frequency (seconds): 60
Next Scheduled Start Time: Start Time already passed
Group Scheduled : FALSE
Life (seconds): Forever
Entry Ageout (seconds): never
Recurring (Starting Everyday): FALSE
Status of entry (SNMP RowStatus): Active
Threshold (milliseconds): 5000
Number of statistic hours kept: 2
Number of statistic distribution buckets kept: 1
Statistic distribution interval (milliseconds): 20
Number of history Lives kept: 0
Number of history Buckets kept: 15
History Filter Type: None
Enhanced History:
----------------------------------------------------------------------
IP SLAの確認用パケットとしてICMPで192.168.1.100へ60秒ごとに送信する設定です。そして、show ip sla monitor satisticsコマンドの出力例は次のようになります。
----------------------------------------------------------------------
R5#show ip sla monitor statistics
Round trip time (RTT)   Index 1
Latest RTT: 48 ms
Latest operation start time: *00:46:33.599 UTC Fri Mar 1 2002
Latest operation return code: OK
Number of successes: 11
Number of failures: 0
Operation time to live: Forever
----------------------------------------------------------------------
最も新しいIP SLAの確認用パケットのRTT(Round Trip Time)、つまり往復時間が48m秒であることがわかります。そして、11回IP SLAによるICMPの接続性の確認が成功していることがわかります。
